What is Ping Plotter?
It is a tool that helps us to determine whether the connection speed is the root of the issue.
Therefore, to determine whether you are experiencing connectivity troubles, we advise utilising PingPlotter. PingPlotter can assist you in locating the difficulties using an understandable graphical method, and it can also monitor your connection over the long term to find more problems. In addition, PingPlotter provides a diagnostic and troubleshooting tool for networks. It allows you to continue collecting data over time and uses a combination of WHOIS, traceroute, and ping to quickly gather data.
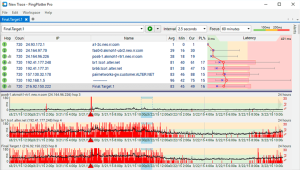
The Pingplotter report displays where and what is happening while your data is being transmitted over the internet using ICMP packets. The locations your data is passing through are represented by each “hop” (numbered on the left-hand side). The first couple of hops are local, with your computer and typically your network or modem being one of them.
Additionally, your ISP and transfer sites are typically found in the middle hops, and your destination is found in the final few hops. Information is lost along the route when a packet is lost. Information stops flowing when there is a 100% packet loss. A firewall, antivirus application, or router that is preventing internet access is typically the cause of 100 percent packet loss on the first, second, or third hop. It may be necessary to call an ISP if there is any partial packet loss in the middle of the hops.
How do we use it?
Step 1:
You must first close all open programmes, including torrents, DC clients, ICQ, Web Browsers (such as IE, Firefox, Chrome, and Opera), Mail clients, and so on. These programmes may tamper with the outcomes of your connection test.
Step 2:
Installing pingplotter on your computer is the next step. Visit the following page to download it:
http://www.pingplotter.com/dl_pingplotter.html
Step 3:
After that, launch pingplotter and maximize the window.
Step 4:
In the “Target Name” field, type in:
login-us.worldofwarplanes.com
Then press Enter.
Note: Please allow this program to run for at least 15 minutes
Step 5:
Finally, click “File” (in the upper left hand of your screen), then click “save sample set.“
Step 6:
Select File, then click “Save Sample Set” (which is a .pp2 file) and attach it to your ticket.

Ping Plotter- a network monitoring tool


